Retirement Income
Risk Management
Retirement income planning is a process of allocating savings to best meet the spending needs of a retiree. The objective behind retirement planning is to structure an income stream that will be enough for the retiree to enjoy their lifestyle but not too much where the funds run out within 30 years. This delicate balance takes careful planning to achieve. Safe Harbor Retirement Planners utilize tools such as the Efficient Frontier model to help with their evidence-based planning.
The efficient frontier model (below) is the set of optimal portfolios that offer the highest expected return for the stated level of risk. Portfolios that lie below the efficient frontier are sub-optimal, because they provide less return for the level of risk. Portfolios that lie to the right of the efficient frontier are also sub-optimal, because of the high risk for the stated profitability or rate of return.
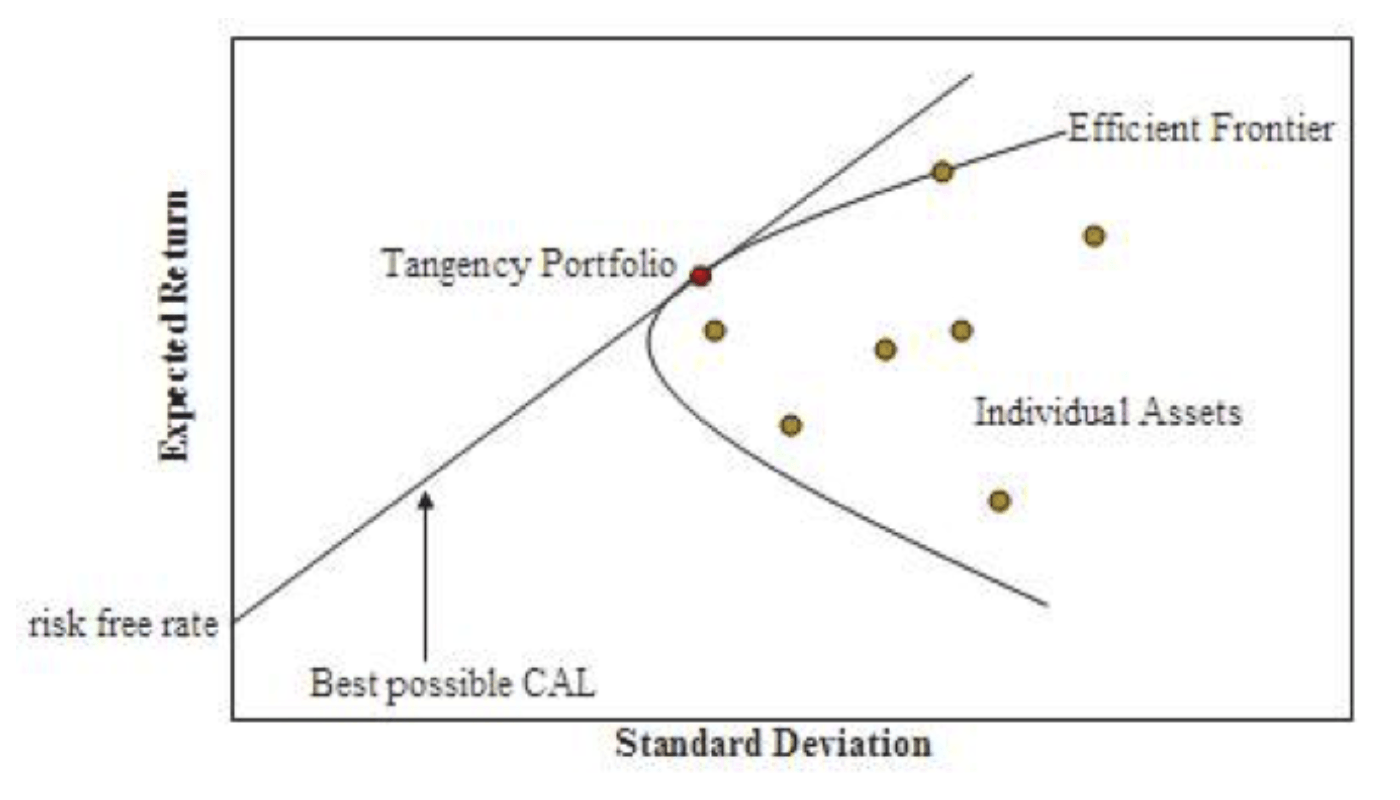
The Efficient Frontier model is a tool to stress test an investment portfolio to gauge whether or not you are maximizing the amount of expected return while minimizing the amount of risk in retirement.
This concept was first introduced by Harry Markowitz who designed the Modern Portfolio Theory (MPT) in 1952. MPT suggests the stock market is efficient and investors should focus on diversifying their investments to optimize the risk / reward ratio. Since 1952, there is further proof stock markets are efficient.
The left axis is the expected return and the bottom axis represents risk. Please note the efficient frontier is curved, rather than linear, a key analysis of the concept is the benefit of diversification. Optimal portfolios that comprise the efficient frontier tend to have a higher degree of diversification than the sub-optimal ones, which are typically less diversified.
Since the goal is to maximize the reward and limit the risk you want to try and get your portfolio as far to the left and high as possible. The perfect investment would be to land very high on the left axis. An example of this would be in the early 1980’s when the US Treasury was offering interest rates over 10%. Unfortunately, due to the current low interest rate environment this is not a reality in today’s economy.
During the accumulation phase (saving for retirement) of your financial life. The efficient frontier model looks like this:
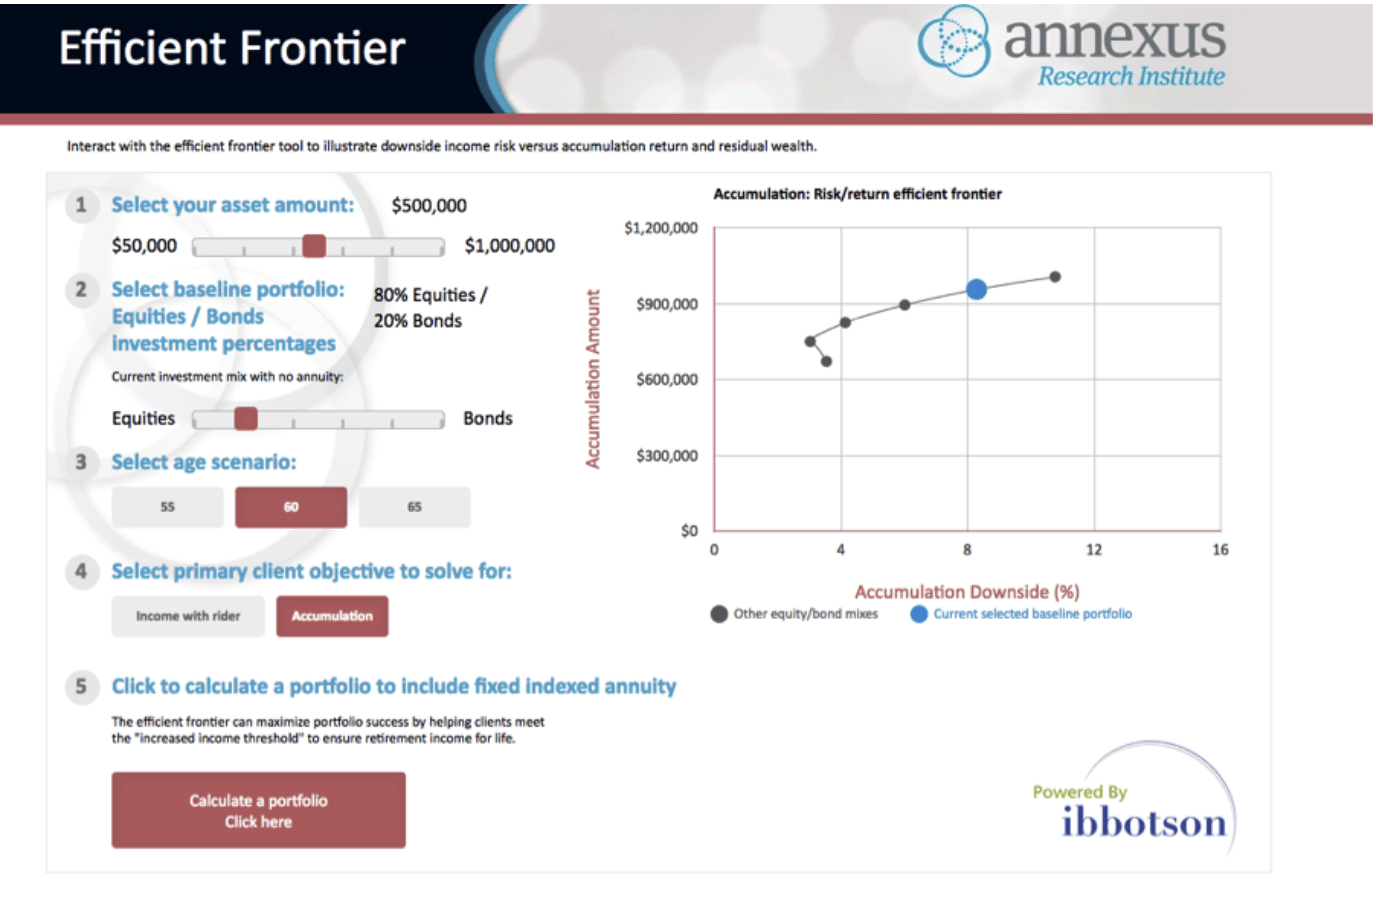
Each dot represents a different allocation between bonds and stocks. Bonds contain less risk so the more bonds in the portfolio will shift the dot to the left. Note on the chart above the dot to the far right is a portfolio holding 100% equities (stocks). You will notice the more equities in the portfolio there is a sharp increase in risk.
In fact, by adding 20% bonds (Blue dot) you are dialing back a significant amount of risk and only lowering the expected return a smidge. Even if you consider yourself to have a high tolerance for risk, there is a point where it may be better to take smart risk.
Another interesting point is the difference of having a portfolio containing all bonds compared to adding stock. The very bottom dot represents a portfolio holding 100% bonds. Most people would believe holding 100% bonds would be less risky than holding a portion in stocks. The efficient frontier shows us otherwise.
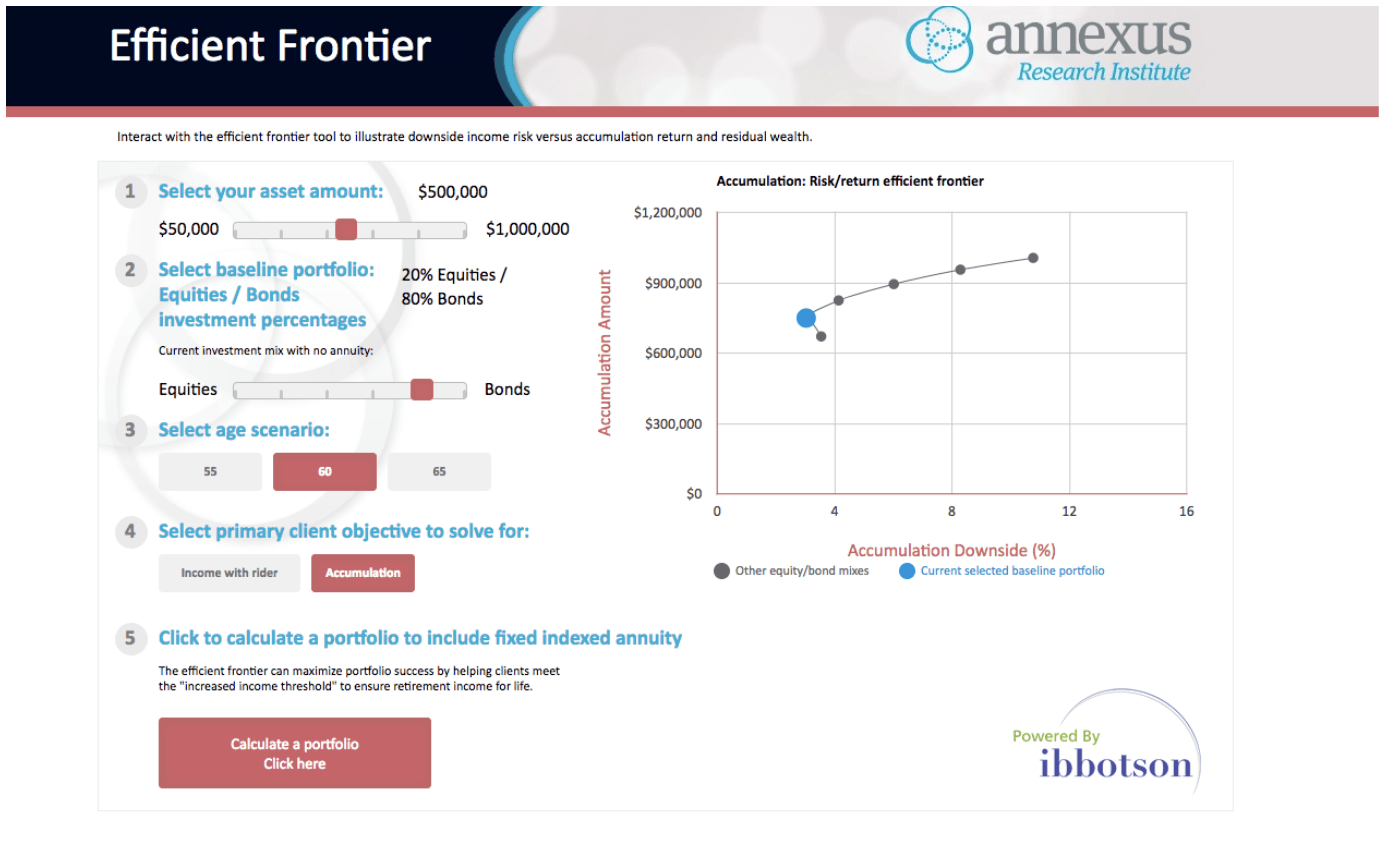
By adding a 20% stock allocation to the bond portfolio (blue dot) will actually increase the expected return and lower the overall risk. If you find yourself to be very conservative, it makes sense to add some stocks to your bond portfolio.
As mentioned, the above charts show the efficient frontier as you are saving for retirement. When a person enters retirement and begins the decumulation-phase of their financial life the efficient frontier makes a major shift. Here is what the chart looks like when you start withdrawing funds from your portfolio.
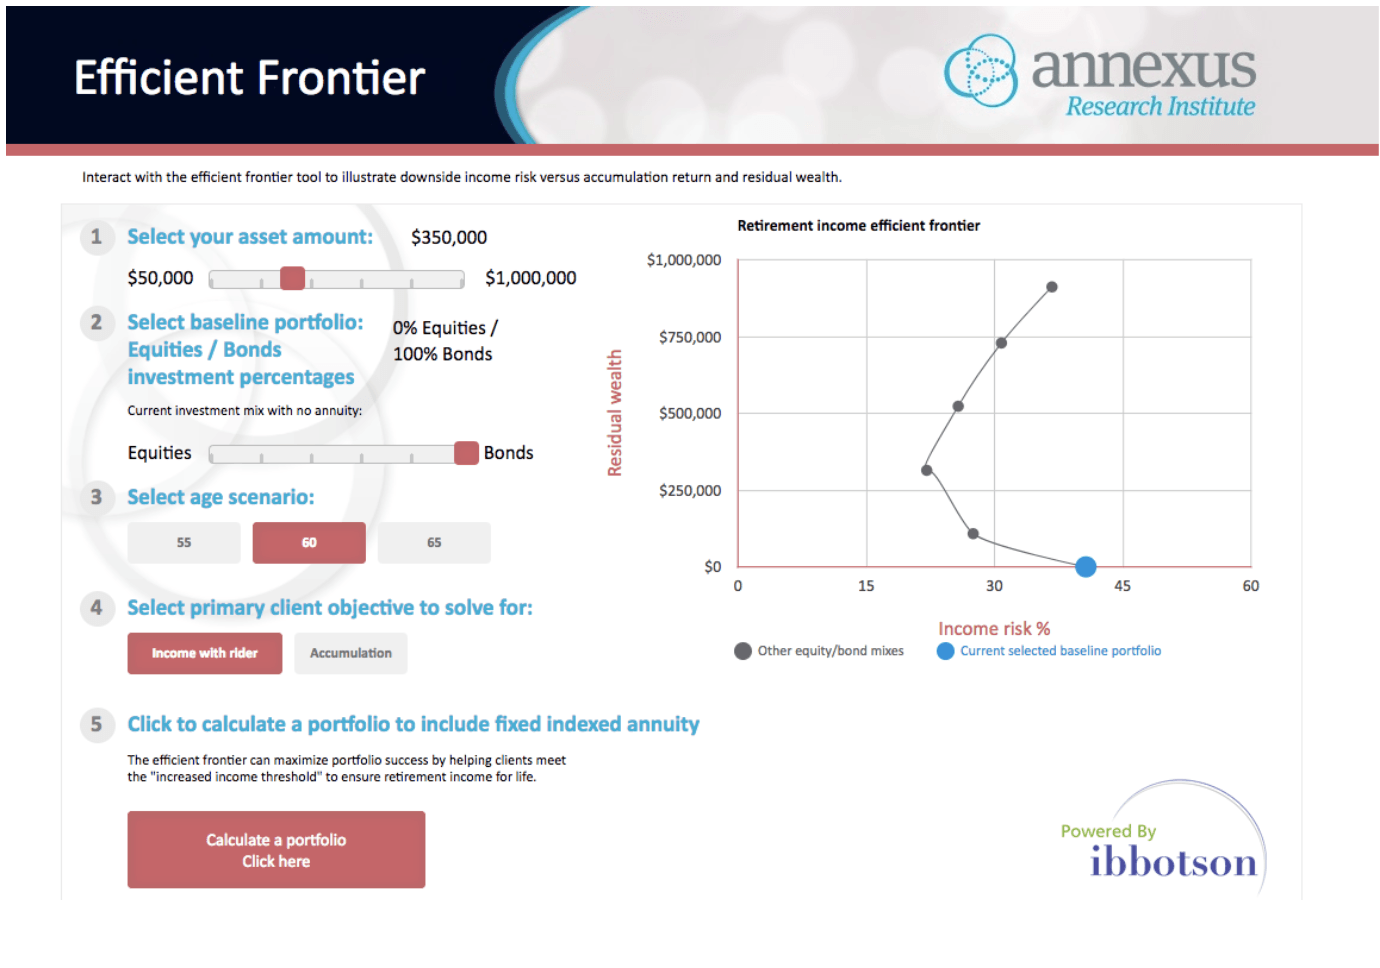
The above chart shows how the risk/reward ratio holding stocks and bonds is much different during the decumulation-phase during retirement. Every portfolio option jumps to the right signifying a drastic increase in risk. In fact, during the accumulation phase the most aggressive portfolio (100% stock) is under 12 on the risk scale. During the decumulation-phase the most conservative allocation (60% bond/ 40% stock) is around 20. Also, notice the amount of risk a 100% bond portfolio contains (blue dot). In fact, the efficient frontier shows holding 100% bonds in retirement contains the highest degree of risk. On top of that, there is no expected reward! We mentioned the perfect portfolio, holding all bonds in retirement turns out to be the worst. This makes sense because if you are withdrawing more from your portfolio than the interest bonds are able to produce you are guaranteed to lose. What is more surprising, is a 100% stock portfolio actually shaves off a little risk and offers a much higher growth potential.
The Efficient frontier is the reason why the 60% stock and 40% bond portfolio has become so popular. This allocation produces a decent mix of expected return and risk.
Our solution to the efficient frontier dilemma while in retirement is by adding another asset class known as the
Fixed Index Annuity.
A Fixed indexed annuity is a special class of annuities that grows based on an underlying equity-based index. Insurance companies offer these types of annuities.
By adding the fixed indexed annuity with an uncapped crediting strategy, we can shift the risk level way down while maintaining a strong expected return. Below is the efficient frontier comparing the uncapped fixed index annuity (Green Line) to the traditional stock/bond portfolio (Gray line).
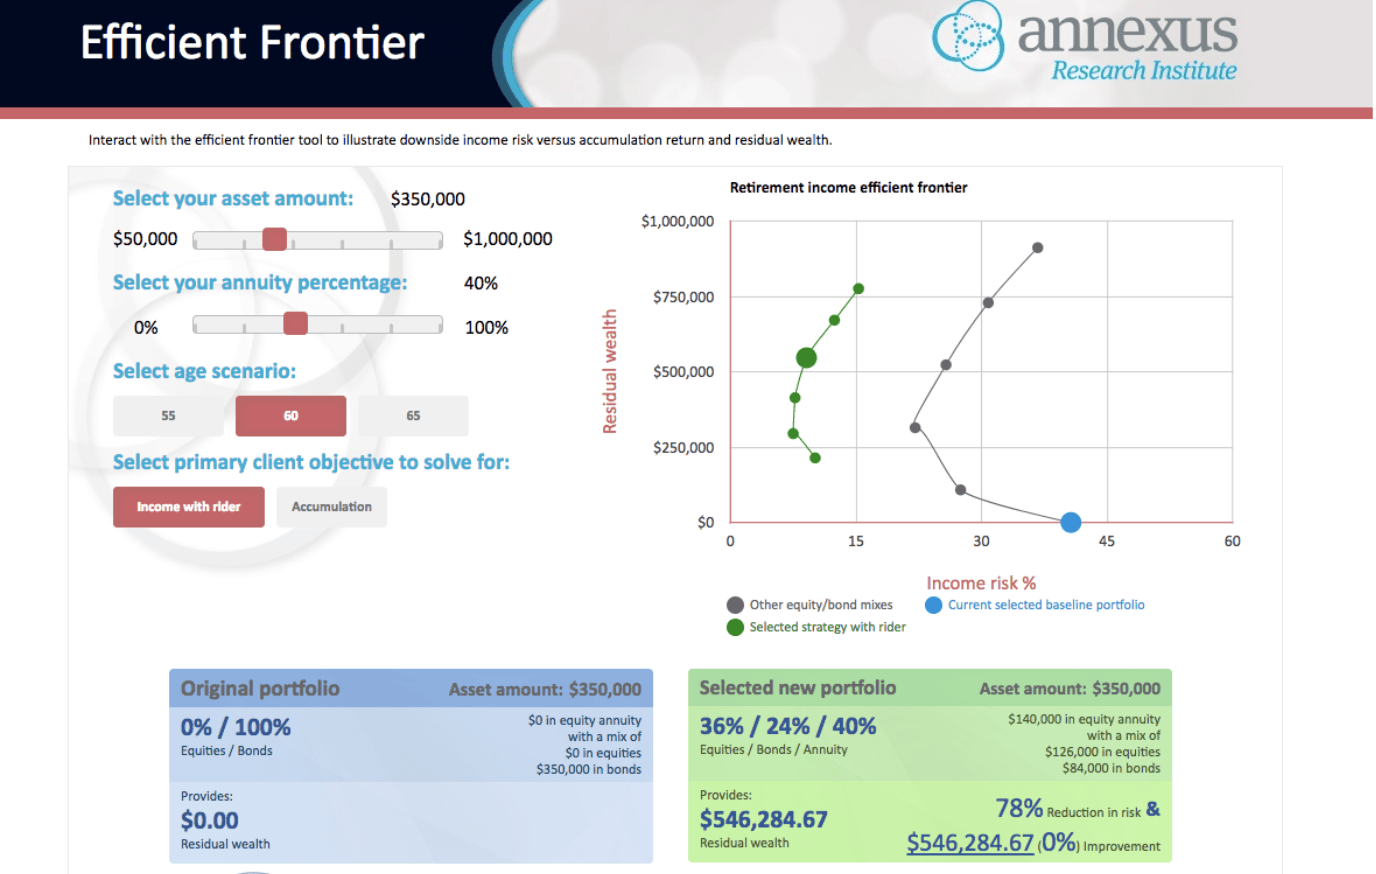
As you can see the line shifts to the left a significant amount. This is why it is very important to work with a professional who specializes in retirement planning. By adding 40% of your allocation to this particular fixed index annuity we are decreasing the risk over half and slightly increasing the expected return of the popular 60% equity / 40% bond portfolio. Feel free to play with the efficient frontier software.
Keep in mind, not all fixed index annuities provide the same result. It is crucial to work with a Registered Investment Advisor to analyze which Fixed Index Annuity will offer the most efficient portfolio for your retirement needs.
Also, not all Registered Investment Advisors offer Fixed Index Annuities. It is important to contact an Independent Fee-based (as opposed to fee-only) RIA. Or you can contact us at 410-538-6800.
* General Study Assumptions
The study used a variety of assumptions to create the analysis and efficient frontiers.
- For the joint life study, assumes each are the same age
- Portfolio modeling used Ibbotson’s 2013 Capital Market Assumptions, these included the following assumptions:
- Equity Mutual fund average return of 9.9% with standard deviation of 19.0%
- Bond Mutual fund average return of 4.0% with standard deviation of 6.5%
- Inflation rate assumption of 2.2%
- Minimum Acceptable Return (MAR) of 0% used to measure downside risk in the savings/accumulation efficient frontier analysis
- In the cases where an annuity income rider was used, the annuity was purchased at select current age with income payments beginning at age 65.
- Residual Wealth and Income risk calculated for a 30 year retirement (i.e. retirement income start age is 65, and the assumed age of death is 95).
- For the joint life and the single life male 65 studies, an initial withdrawal amount of 4.0% of the investable assets was used to determine the initial amount of income in the study. The withdrawal amount was increased each year by inflation.
- Taxes were not included in the analysis.
- For fixed indexed annuities, no actual annuities were used for the study. Instead, Ibbotson and Annexus Research Institute created a set of generic annuities with the following attributes:
- Base growth:
- 60% S&P500
- 40% into 1% Declared Rate
- 1.50% Strategy Fee
- Income Rider: Accumulation Phase (if roll-up or deferred income, i.e. age 55 and 60):
- 0.85% fee annually
- 8% income bonus based on initial investment amount (year 0)
- Stacked growth of 3% base plus 150% of 2yr interest credit amount
- Two payout options:
- 5% nominal at age 65
- 4% inflation-adjusted at age 65
- Once you move from the baseline to the calculation page, the default assumptions are as follows:
- move 40% of portfolio from bond to annuity
- increase equity allocation for remaining assets by additional 20% over baseline
- These defaults are a general starting point for comparison vs your non-annuity baseline. It does not represent an optimized or recommended allocation from either Annexus or Ibbotson/Morningstar. Once on the calculations page, you can vary and change each of these inputs to meet your client's objectives.